Time In Range: What is it? How Does it Help?
You may have heard the recent buzz about Time in Range... but is this newly-popular data point any better than A1C? Here we'll explain what exactly "Time in Range" means, and how it can help you reduce your child's blood sugar swings + lower their A1C. We'll also discuss what counts as "in range" (according to the International Consensus on Time in Range), how Time Below and Above Range are necessary parts of the picture, as well as the benefits of these metrics (vs. frequency and average blood glucose measures).
What is Time in Range?
Time In Range (TIR) tells you how much time your/your child's glucose was within target, expressed as a percentage. For example, if your Time in Range for the past week was 60%, that means that 60% of all the sensor glucose readings for that week fell within your target glucose range.
The term Time in Range usually refers to data from a Continuous Glucose Monitor (CGM) or an Intermittent Scan (“Flash”) Glucose Monitor.
It could also be used when talking about non-sensor-based data, but in the case of fingerstick readings from a blood glucose meter we usually refer to minimum/max blood sugars and standard deviation. In the case of veinous blood tests, we talk about average blood glucose, represented by Hemoglobin A1C (HbA1C). The limitation of this HbA1C blood test is that the resulting number (such as 7.2%, or 8.9%) reports an average blood glucose over the past few months, which doesn’t tell us about the specific glucose excursions (highs and lows) that got us here.
Time In Range, on the other hand, paints a much clearer and detailed picture, telling us how much variability there is within the glucose readings:
- How often does your child's glucose wander high? This is referred to as Time Above Range (TAR).
- How much time do they spend low? This metric is called Time Below Range (TBR).
- For what amount of time did their glucose sit “just right?” As we mentioned, this refers to Time in Range.
Time in Range relates directly to hours and minutes of the day. For example, if TIR was 50% yesterday, then your child's glucose levels were in range for 50% of the total 24 hours, which corresponds to 12 hours. If your Time Above Range (TAR) was 25%, then glucose was high for 6 hours. If your Time Below Range was 3% then they spent about 45 minutes in the low zone. Each percentage point (1% of the day) is equivalent to about 15 minutes of the day.
What Counts as “In Range”?
Your/your child's target glucose range should be individualized based on factors like risk level and age, but the International Consensus on Time in Range (2019)1 suggests the following general guidelines for individuals with Type 1 or Type 2 Diabetes under the age of 25:
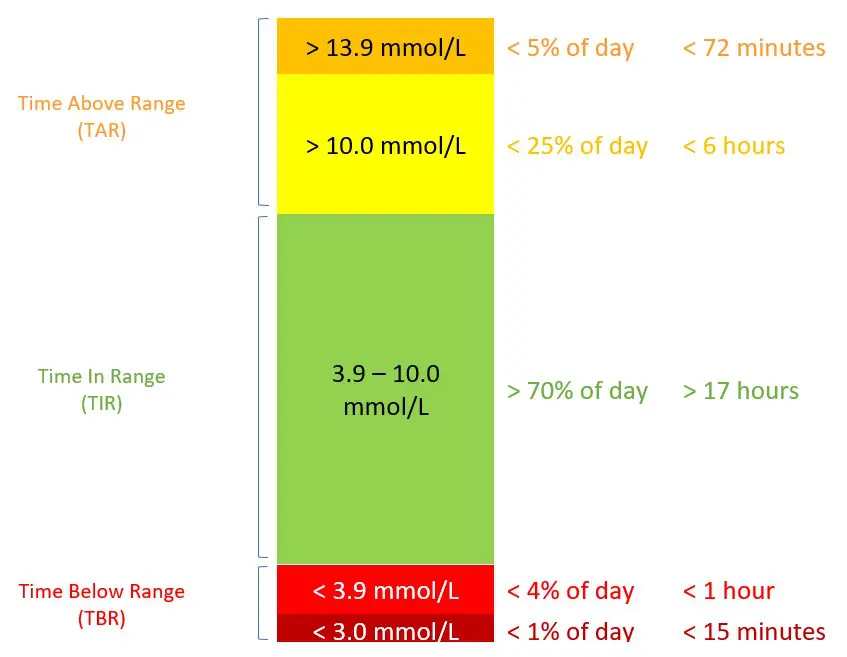
- The suggested target glucose range for many children, teens and young adults is 3.9 - 10.0 mmol/L.
- Anything over 10.0 mmol/L would be considered Above Range, with 10.0 – 13.9 mmol/L being High, and readings above 13.9 mmol/L considered Very High.
- Readings below 3.9 mmol/L would be considered Below Range, with 3.0 – 3.8 mmol/L being Low, and readings below 3.0 mmol/L considered Very Low.

In terms of goals, the Consensus Guidelines suggest that we strive for:
- around 70% Time in Range (the green area), which works out to about 17 hours/day.
- Time Below Range (reflected in both of the red areas in the graphic) should be less than 4% (including less than 1% time spent below 3.0 mmol/L, the dark red area). This works out to less than 1 hour of your day spent below range (and even less is even better!); of that hour, less than 15 minutes should be spent with glucose levels Very Low.
- Time Above Range (the orange areas at the top of the chart) should be less than 25% (including less than 5% time spent above 13.9 mmol/L). This works out to less than 6 hours spent with glucose levels above 10.0; within those 6 hours, we should strive to spend less than 72 minutes in the Very High glucose range (14.0 and higher).
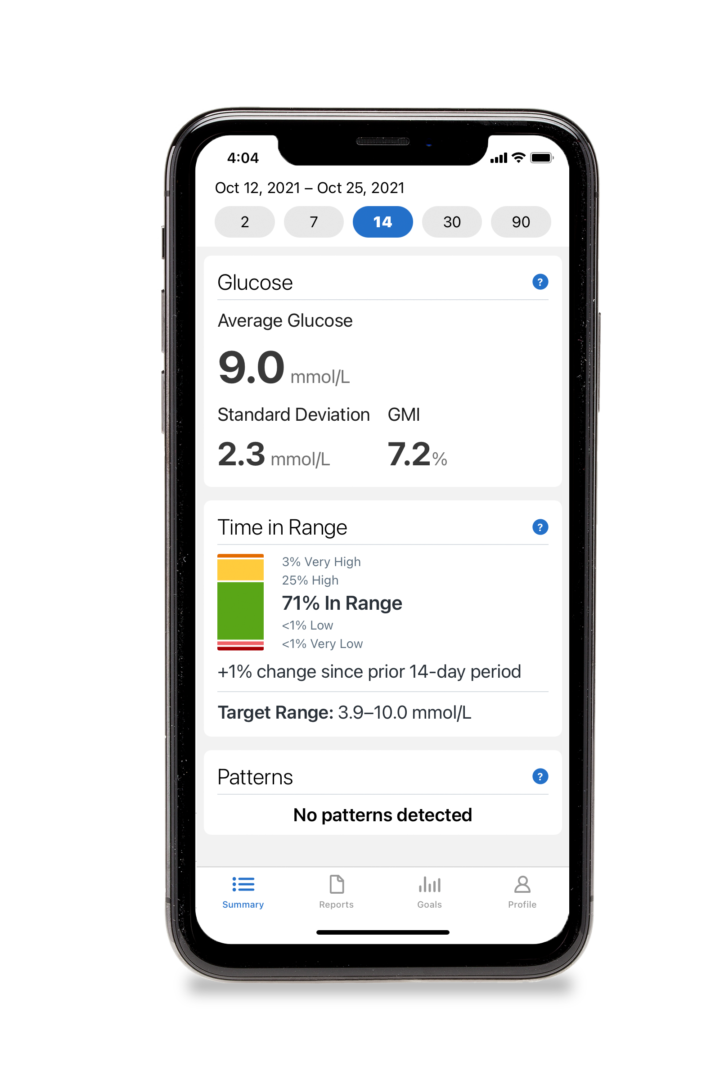
These goals should be adjusted for your child’s individual needs. For example, when our son was a toddler, his target glucose range was 6.0 – 12.0 mmol/L (rather than 4.0 – 10.0 as suggested above). For those who would like to set tighter TIR goals, glucose levels of 4.0 – 7.9 have been suggested, in which case Time Above Range (TAR) would include anything over 8.0 mmol/L. You can set your boundaries to meet your own individual goals, just by changing the settings in the Clarity App or other sensor glucose app.
Does Time in Range Really Matter?
There are many benefits to using Time in Range as a yardstick to assess whether you’re meeting your glucose management goals:
1. Feedback, Please!
When we use A1C as the yardstick, we only get feedback every three months. As pointed out in the 2021 Updates to the Diabetes Canada Clinical Practice Guidelines, in the chapter on Blood Glucose Monitoring in Adults and Children with Diabetes2, “A1C is a measure of chronic glycemic levels over months and does not provide information that can inform immediate/short-term decisions.”
What do we do in the meantime to check in on the effectiveness of our current diabetes management strategies? Time In Range gives us practical, real-time feedback on how well our day-to-day diabetes management strategies are working; if our goals are not being met, we don’t need to lose three months before making changes, adjusting insulin doses, or handling certain foods differently.
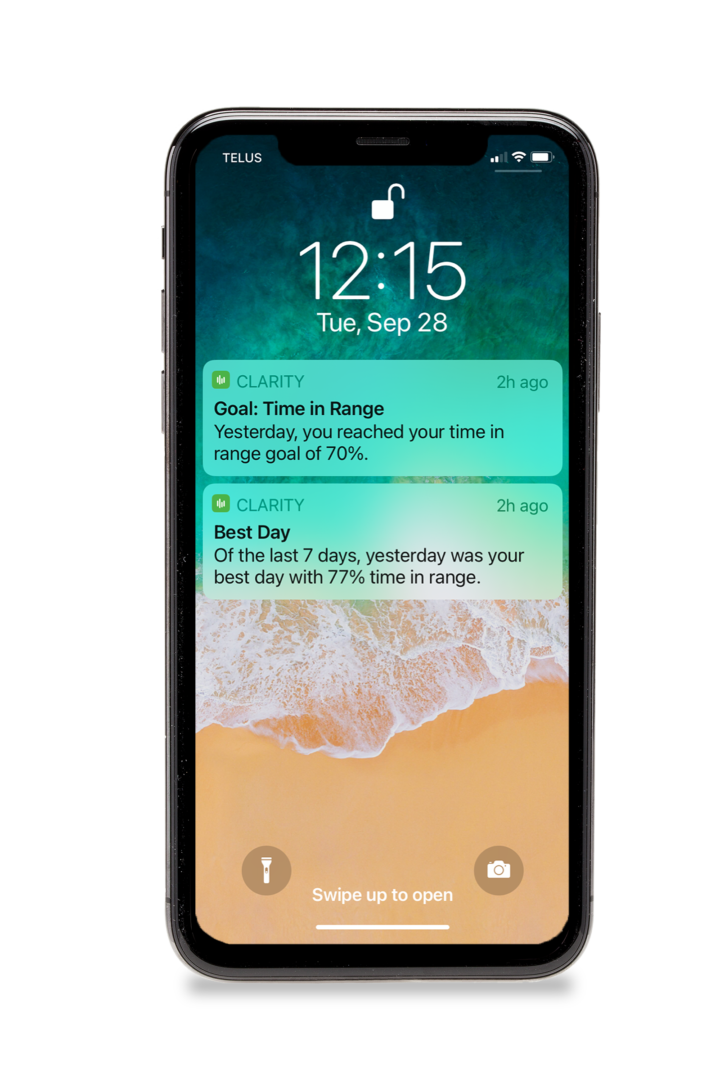
With the CLARITY app and Time in Range notifications, you can have your finger on the pulse of how things are going – on a weekly, or even a daily basis if you want. The immediate feedback helps you take action sooner, so your child stays in range for more time every day. And in the words of one Dexcom-user, “When you’re in range, you just FEEL better. And when you feel better, you do better. Life is better.”
2. Staying Motivated
This immediate feedback is a much more tangible way to stay motivated from day to day. While managing this condition is never perfect, every once in awhile when you (or your child) have a really good day – it’s like getting a congratulatory high-5 and some acknowledgment that otherwise never really happens.

3. The View is Clearer Up Here
The HbA1C test result does a good job of predicting the risk of long-term complications, but an A1C result of 7.5% (recommended for children and teens under the age of 18 years in the 2018 Canadian Diabetes Association Clinical Practice Guidelines³) doesn’t distinguish between individuals with similar average glycemia but with different patterns of highs and lows.
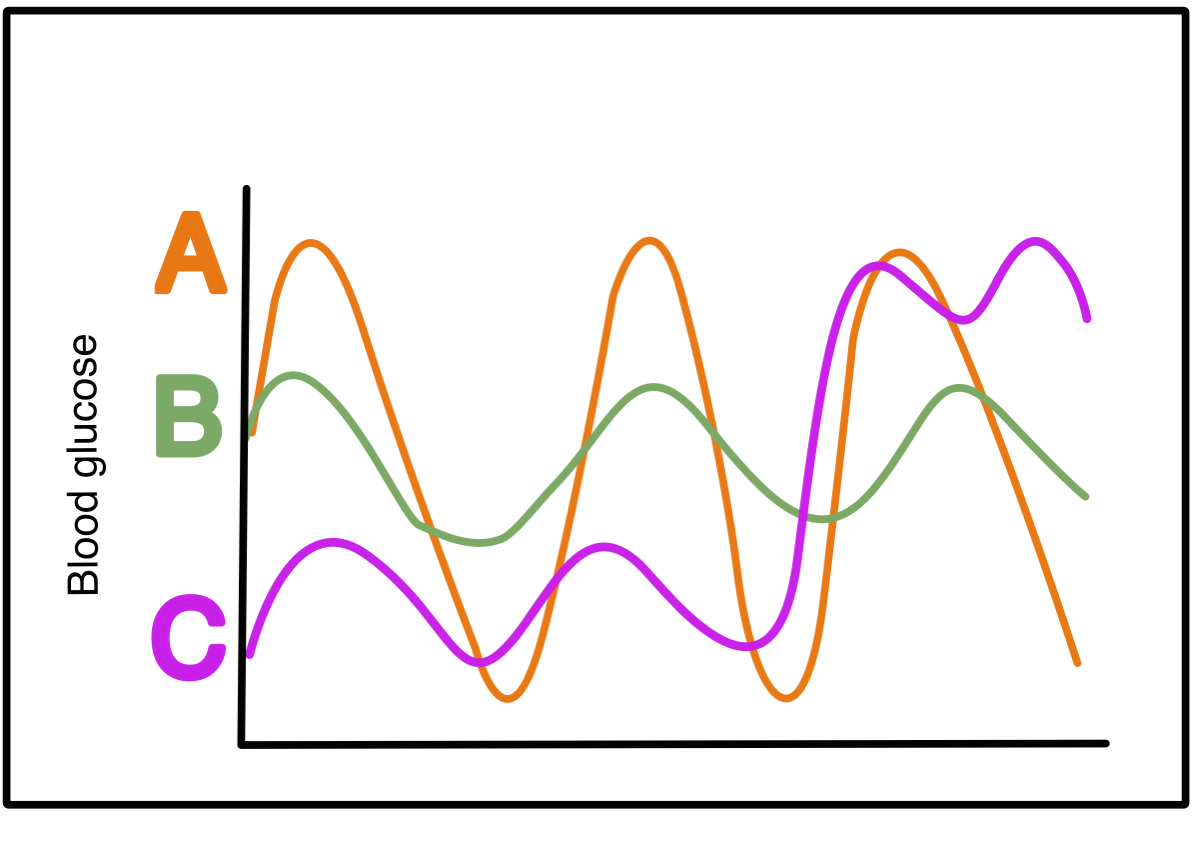
Consider three Dragon Tamers who all have the identical A1C’s but very different glycemic patterns:

Dragon Tamer A's glucose levels bounce from the extreme highs to the extreme lows and back again. This person has the same A1C as Dragon Tamer B, whose glucose levels don’t vary much, hovering around 10 mmol/L, sometimes a bit higher, sometimes a bit lower, but largely without extreme glucose swings. Both of these diabetes warriors have the same A1C as Dragon Tamer C, who spends half her day fighting off low glucose, and then the second half of her day fighting off highs. As you can see, as a measure of average blood glucose, the A1C result can mask the variation and extremes within a data set; it doesn’t give us specific information about the frequency of complication-causing high blood glucose (BG), nor does it tell us about the occurrence of potentially dangerous low BG.
Reviewing your TIR data, on the other hand, helps you see how effective your glucose-managing efforts have been, giving you a more detailed picture of how of what’s actually going on with your glucose and when: you get more information about how much time was spent in range, high and low than from the overall average of A1C, plus more detail than from the “moment in time” snapshot of fingerstick BG readings.
As Gabrielle Schmid (RD, CDE, CPT, diagnosed T1D at 9 years old) points out5: 10-12 fingersticks per day (considered intensive self-monitoring of blood glucose) give you information about 10-12 seconds out of your day, while CGM gives you a more complete picture, capturing all of the times glucose levels wandered into the high and the low ranges.
4. Low Again???
Regularly reviewing your child's TIR data also helps you see how effective your low-prevention strategies have been. As we know, there are specific risks to our glucose dropping below target too often; our body’s glycogen stores may become depleted without us knowing it’s happening, increasing the risk of a severe low in the future. But checking in on Time in Range data lets you know how much time they're spending Below Target Range (hypoglycemic).
As highlighted by Lori Berard (RN, CDE, co-author of the chapter on Monitoring Glycemic Control in the 2018 Diabetes Canada Clinical Practice Guidelines): when looking at a TIR bar graph, it’s easy to assess the risks related to hypoglycemia, since less time in the red zone means lower risk. That means we can more easily keep an eye on keeping our kids safe by seeing at a glance whether we need to make some changes.
5. How Stable?
Most of us understand that prolonged high BG increases the risk of long-term diabetes-related complications. But do you know that the swings (from target, to high, to low, and back again) also increase this risk?
When you look at Time in Range, you can tell how stable your glucose levels are: higher TIR indicates a more stable glucose profile (that is, fewer excursions into the extremes). For example, 70% TIR indicates more stability in your glucose readings than 50% TIR would. In fact, for every 1% increase of Time in Range, your child is spending 15 more minutes each day within target (neither high nor low), and fewer glucose swings predicts better long-term health.
6. Lifting the Burden
Tending to the diabetes dragon is time-consuming and sometimes worrisome, leading to mental and emotional fatigue. But when you can see what’s going on in real-time, when you can assess how things are going on a daily basis, then you don’t have to worry about the monster under the bed, reducing diabetes distress and worry. Further, using sensor-based tech and TIR summary data can reduce all those actions and decisions you have to make in a day when you’re living with the diabetes dragon…
from not having to wash your hands to check your glucose, to not having to wonder how things worked out with that pizza for lunch, to not having to worry as much about your child’s glucose going low in the night… all of the benefits 1-5 outlined above can reduce the burden of taming the diabetes dragon, so you can spend less time and energy on diabetes, more on living life.
NEXT STEPS (COMING SOON):
How to Increase Your Time in Range.
References:
Battelino, T., Danne, T., Bergenstal, R. M., et al (2019). Clinical Targets for Continuous Glucose Monitoring Data Interpretation: Recommendations From the International Consensus on Time in Range. Diabetes care, 42(8), 1593–1603. https://doi.org/10.2337/dci19-0028
This international consensus report has been endorsed by International Society for Pediatric and Adolescent Diabetes (ISPAD), JDRF, and Pediatric Endocrine Society, as well as the American Diabetes Association, American Association of Clinical Endocrinologists, American Association of Diabetes Educators, European Association for the Study of Diabetes, and Foundation of European Nurses in Diabetes.
Alice Y.Y. Cheng MD, FRCPC; Denice S. Feig MD, FRCPC; Josephine Ho MD, FRCPC; Rick Siemens BSc Pharm, CDE. Diabetes Canada 2018 Clinical Practice Guidelines for the Prevention and Management of Diabetes in Canada: Blood Glucose Monitoring in Adults and Children with Diabetes: Update 2021. Can J Diabetes 45 (2021) 580-587.
Diabetes Canada Clinical Practice Guidelines Expert Committee. Diabetes Canada 2018 clinical practice guidelines for the prevention and management of diabetes in Canada. Can J Diabetes 2018;42(suppl 1):S1-325.
Suh, S., & Kim, J. H. (2015). Glycemic Variability: How Do We Measure It and Why Is It Important?. Diabetes & metabolism journal, 39(4), 273–282. https://doi.org/10.4093/dmj.2015.39.4.273
Understanding Alerts and Time in Range in Real Life, presentation by Gabrielle Schmid (RD, CDE, CPT) at Diabetes Canada’s Know No Limits with T1D conference, Oct 2, 2021 https://nolimitsconference.ca/
Gabrielle is a Registered Dietician (RD), Certified Diabetes Educator (CDE), and Certified Pump Trainer (CPT). She has also lived with diabetes since she was 9 years old.
SHARE THIS ARTICLE
